

Market Performance
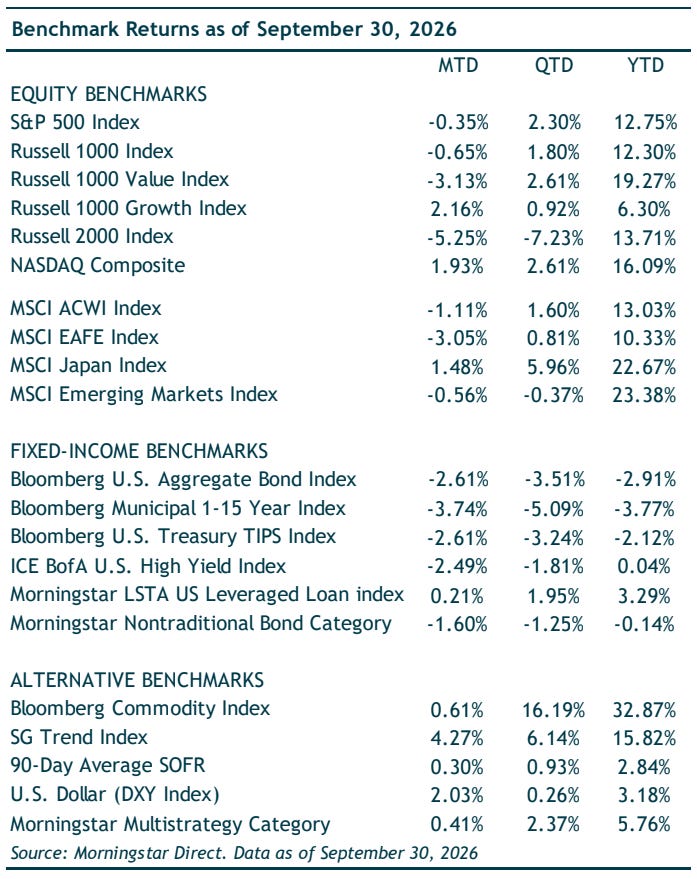
Key Takeaways
The S&P 500 rose 2.3% in Q3 to a record 7,652, but the bond market stole the show. The Fed delivered its first rate hike in over three years. The 10-year and 30-year Treasury yields went to multi-decade highs of 5.29% and 5.63%, respectively.
The unanimous September 16th rate hike to 3.75%–4% united a previously split Committee (9–3 in July). With projections pointing to another increase this year, Chair Warsh firmly emphasized that inflation remains unacceptably high.
The rise in Treasury yields stem from more than inflation. While cooling inflation benefited from a BEA methodology update alongside upwardly revised GDP growth, higher yields were also driven by a strong CAPEX driven economy, massive Treasury and corporate bond supply, slowing foreign demand, and a hawkish Fed.
The ongoing war with Iran drove Brent crude oil up roughly 35% this quarter, briefly topping $108 in September. Meanwhile, the AI trade completed a full 360° turn—dropping in July before rebounding on NVIDIA’s August earnings—as Q3 earnings growth expectations reached nearly 29%. Ahead, we preview the November midterms and upcoming Fed meetings.
Market Overview
Though the S&P 500 rose a modest 2.3% in Q3 (up 12.7% YTD), the bond market drove the overarching narrative. The Fed delivered its first rate hike in over three years, long-term Treasury yields hit two-decade highs, crude oil surged over a third amid reignited conflict with Iran, and the AI trade completed a full round trip.
The quarter saw divergent internal market performance. The Nasdaq gained 2.6% to reach a record above 27,244 in late September, whereas the Dow Jones Industrial Average dropped 2.3% (falling 4.1% in September) and the Russell 2000 Index dropped 7.2%.
Strengthened by a rising USD, international markets underperformed: European equities (MSCI Europe TR) declined 1.6% in USD terms (-0.9% local) and emerging markets (MSCI Emerging Markets TR) fell 0.4%. Conversely, Japanese stocks (MSCI Japan TR) led major markets, gaining nearly 6% in USD terms, significantly aided by the Yen’s 2.5% local appreciation against USD.
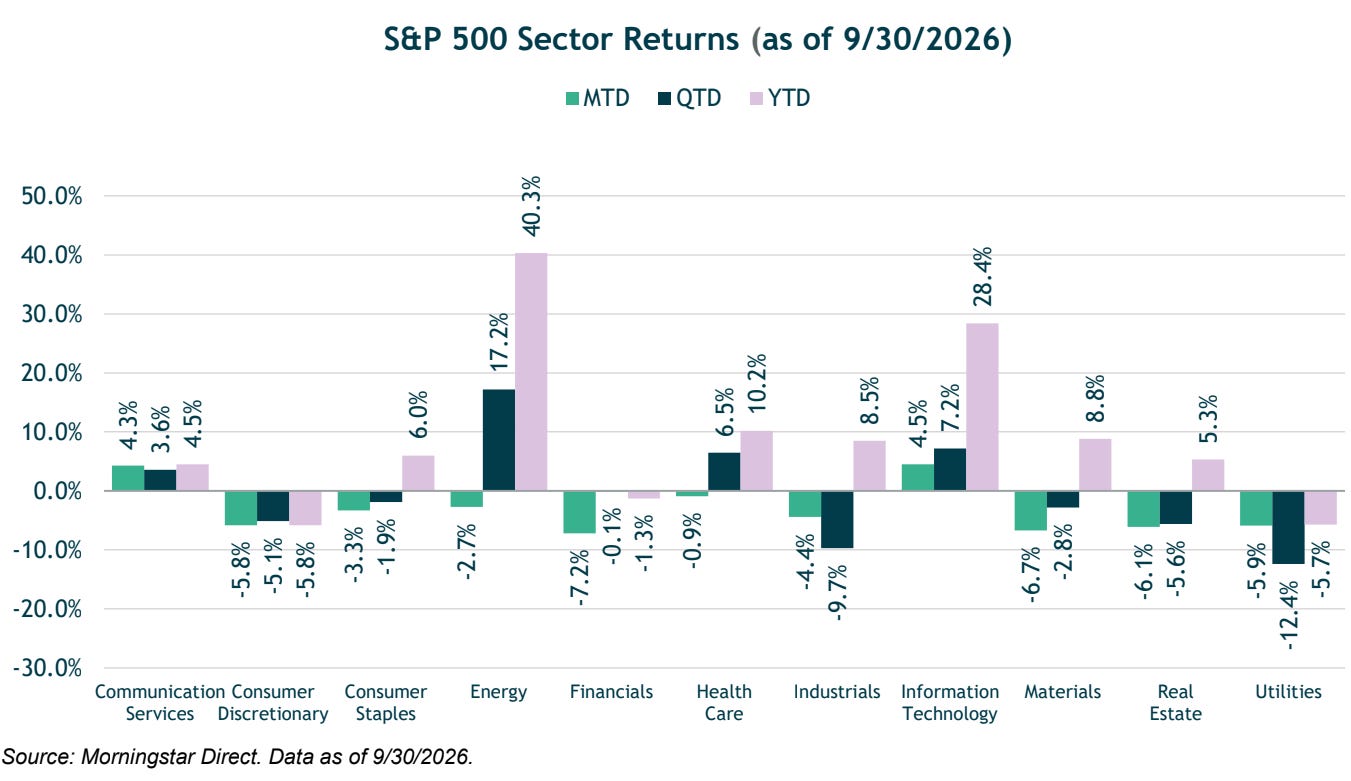
Sector returns varied widely. Rising September yields pushed financials down over 7% in its worst month since early 2023, while energy gained on oil price shocks and technology rose on AI optimism. After broadening early in the year, the market re-concentrated in Q3. In September, the cap-weighted S&P 500 was flat while the equal-weighted index fell 4.8%, placing the cap-weighted version ahead YTD. Widening performance dispersion leaves only two of 11 GICS sectors outperforming the S&P 500’s 12.7% YTD return, as shown below.
The US economy continues to grow and outpace expectations. Following a summer labor slowdown—adding just 52,000 jobs across June and July—August payrolls rebounded by 162,000 (versus ~55,000 expected), holding unemployment at 4.1%. Q1 and Q2 GDP growth were revised up to 2.5% and 2.2%, respectively, driven by the largest capital spending boom in modern history. While this economic momentum supports earnings, it complicates the path for interest rates.
The Fed Hikes: Warsh’s Stance
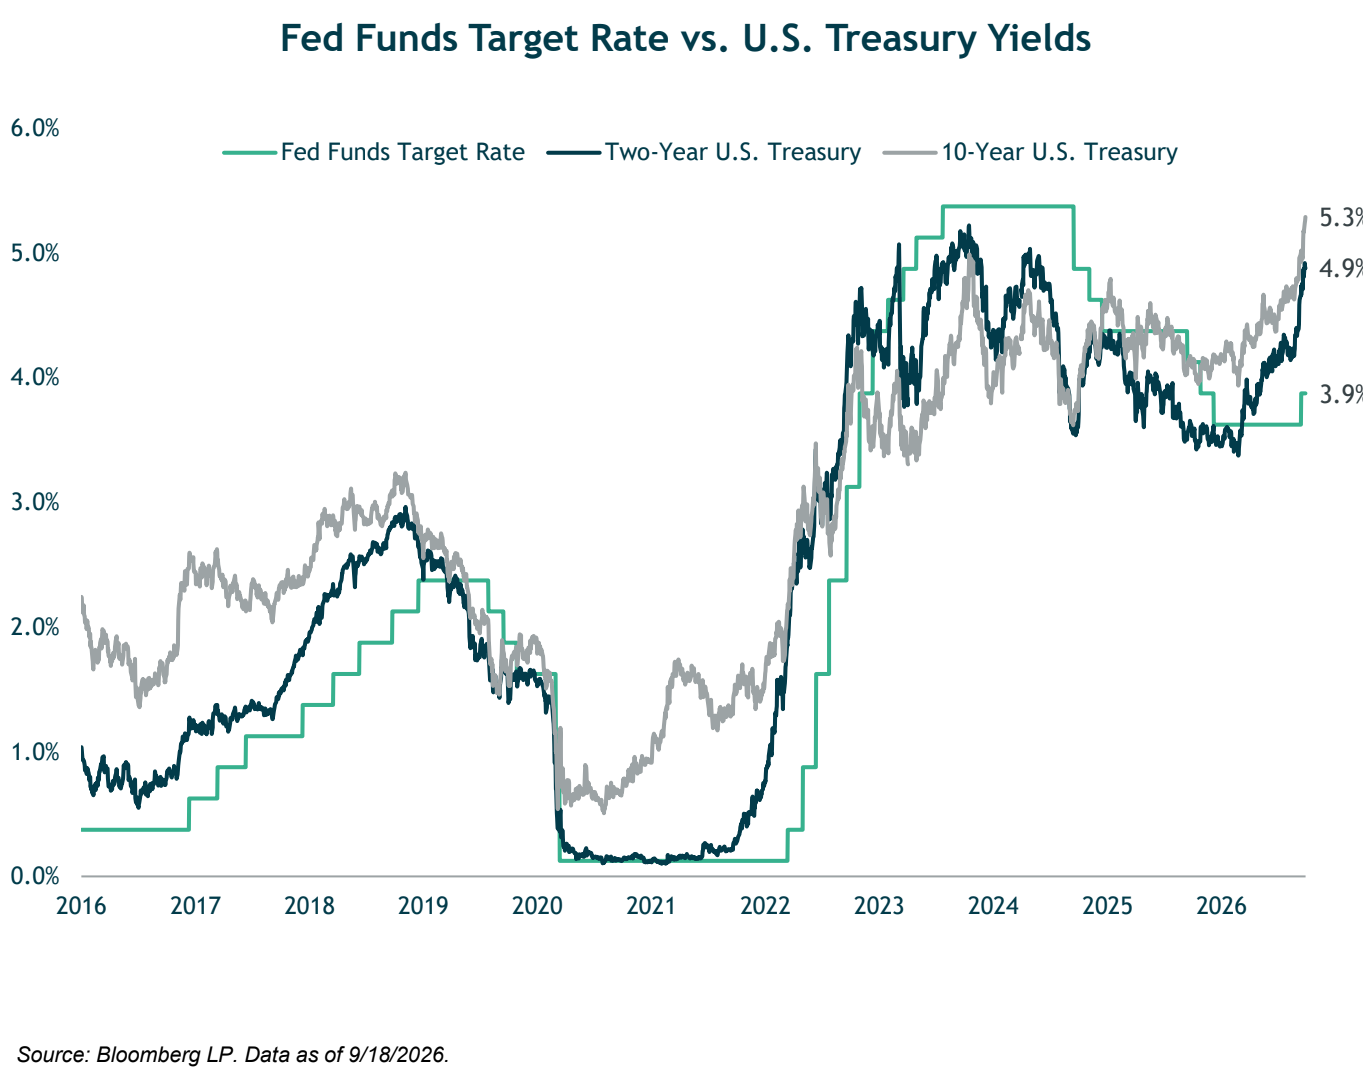
On September 16th, the Federal Open Market Committee raised the federal funds rate by 25 basis points to 3.75%–4%, marking the first rate hike in over three years and reversing late-2025 easing. Fed Chair Kevin Warsh has maintained a hawkish anti-inflation stance, defying expectations and the Trump Administration's push for lower rates. Following hawkish June dot plots, a split 9–3 hold in July, and a firm inflation warning at Jackson Hole in August, Warsh led the Committee to enact the rate increase.
The vote itself is telling. In July, three dissents favored a hike. By September, the 12–0 vote showed Chair Warsh had united a divided Fed around an unfinished inflation fight within four months, despite White House objections.
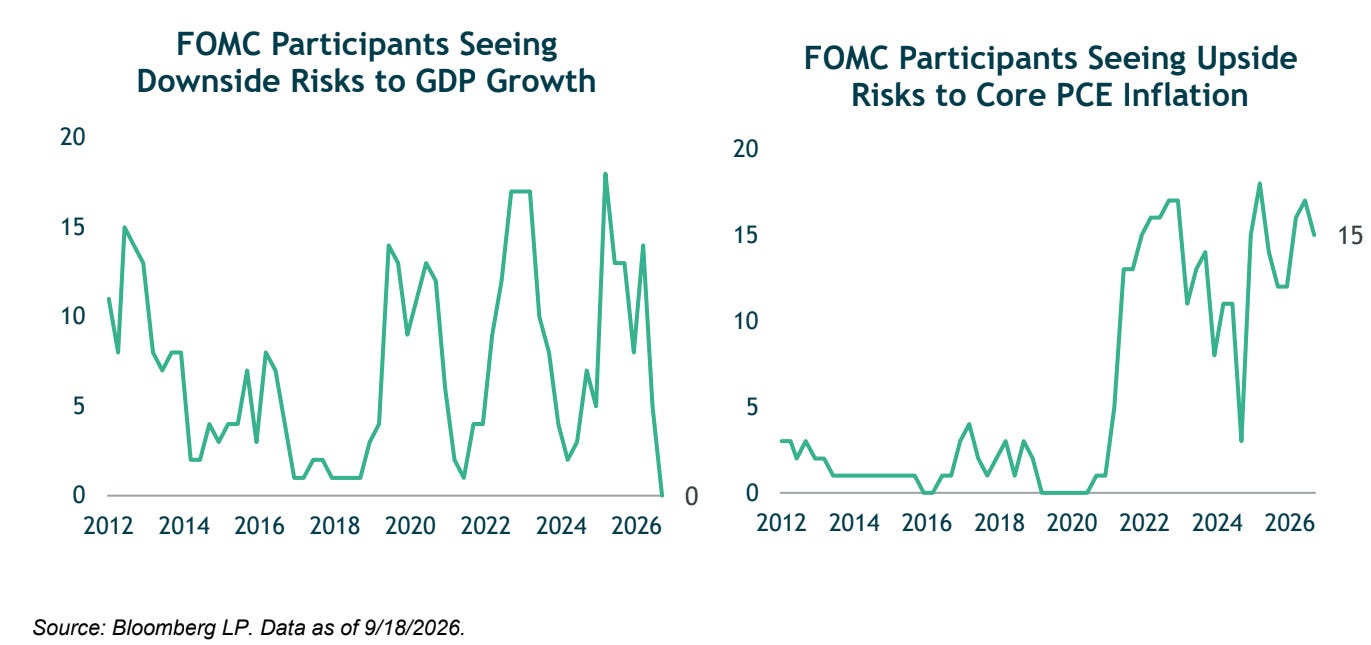
The FOMC’s projections reinforced its hawkish stance. The median federal funds rate forecast rose to 4.1% for both year-end and 2027, signaling higher rates for longer and at least one more hike at the final two meetings. September estimates show committee members view inflation risks as skewed to the upside, with economic growth concerns secondary. While Chair Warsh again refrained from submitting a projection or providing explicit guidance, he reaffirmed the Fed’s commitment to price stability.
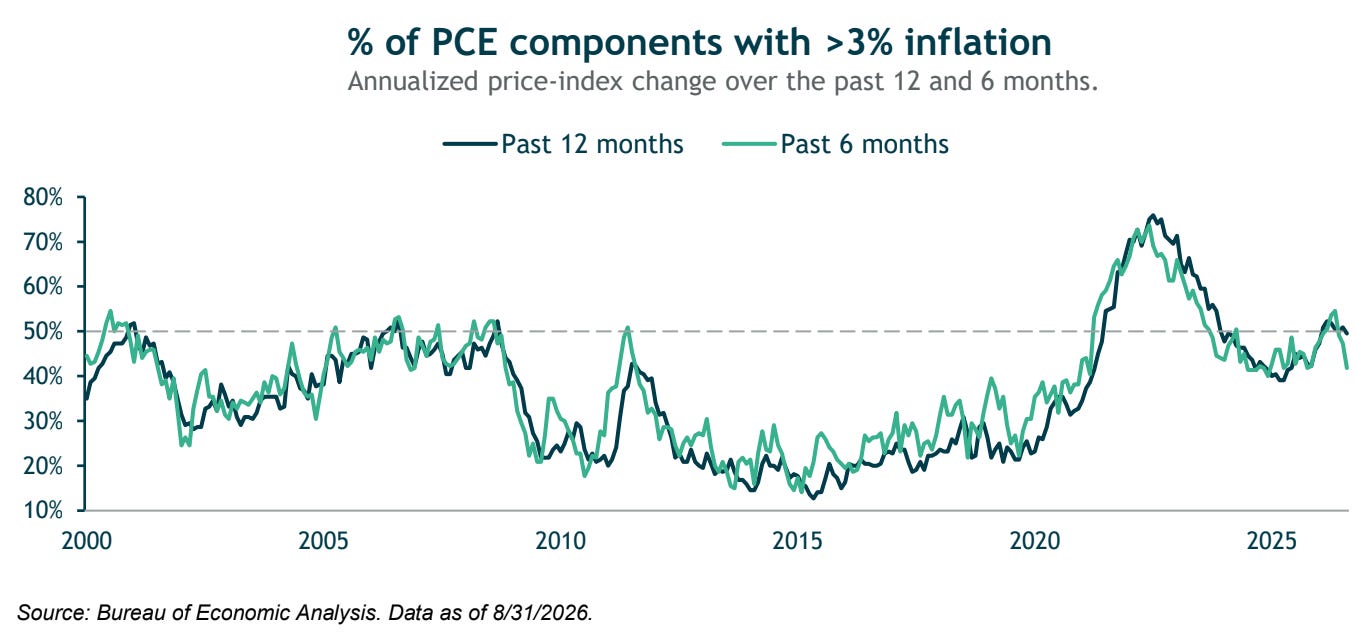
The Fed's hawkish rate hike coincided with cooling inflation data, aided by the BEA's annual methodology revisions to services inflation across the past five years. July core PCE was revised down to 3.0% (from 3.3%), August core PCE held at 3.0% (below 3.3%+ expectations), and August headline inflation hit 3.4%.
Despite lower numbers, core inflation remains 1% above target, with key services categories near 4% and September facing rising oil prices. Because inflation remains inconsistent with its mandate, the Fed is expected to hike once more this year, likely in December post-midterms.
No Time to Buy: Long-End Repricing

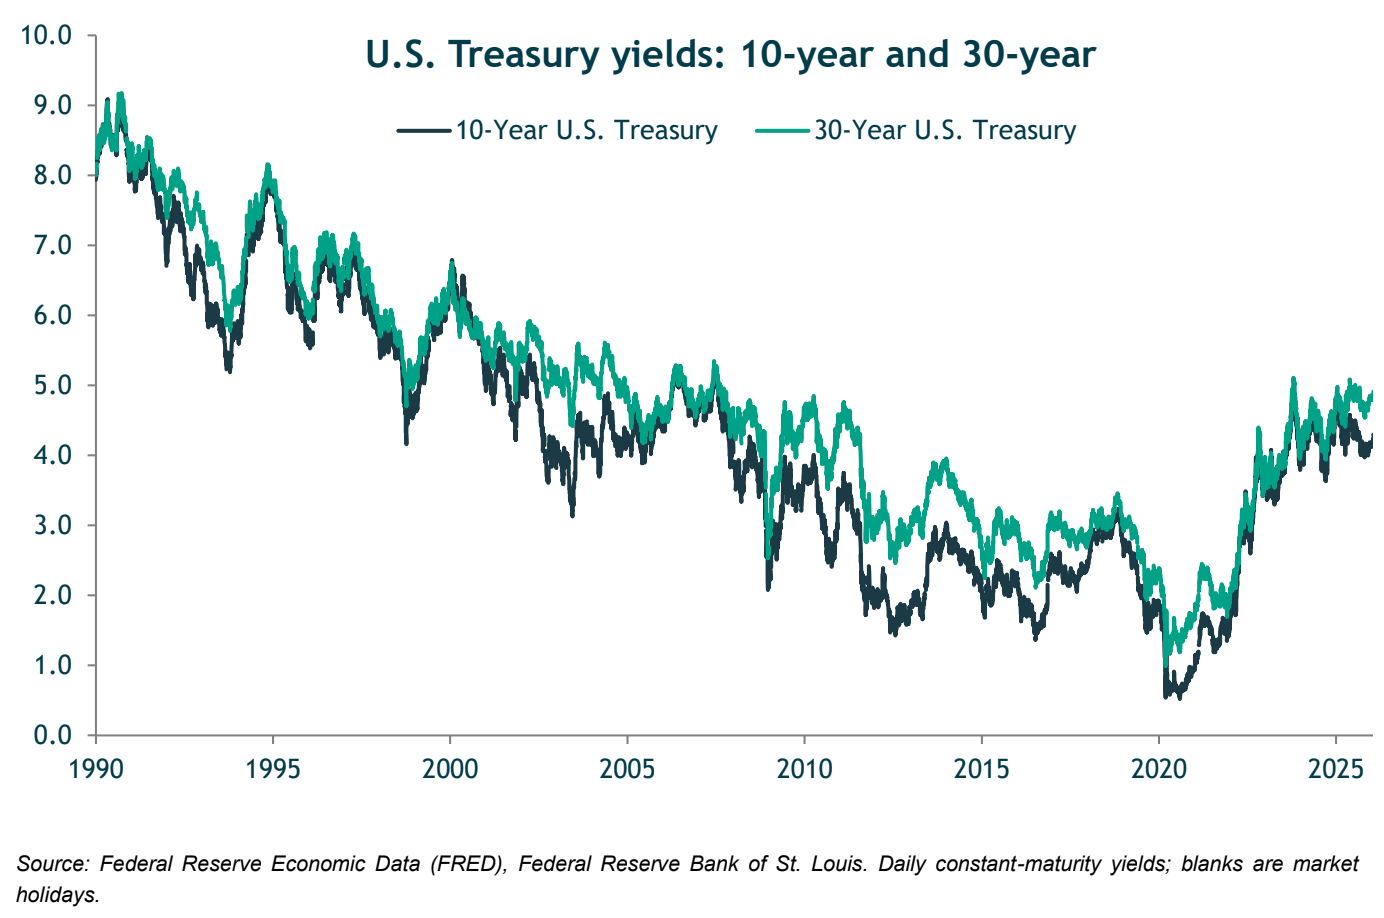
The 10-year Treasury yield closed Q3 at 5.29%—nearing its 2007 peak after jumping over 50 bps in September—while the 30-year reached 5.63%, a high last seen in 2002. A late-September Bloomberg poll revealed most respondents expect long bond yields to cross 6% before year-end. Overall, the yield curve bear-steepened, with long-term rates outpacing short-term rate increases.
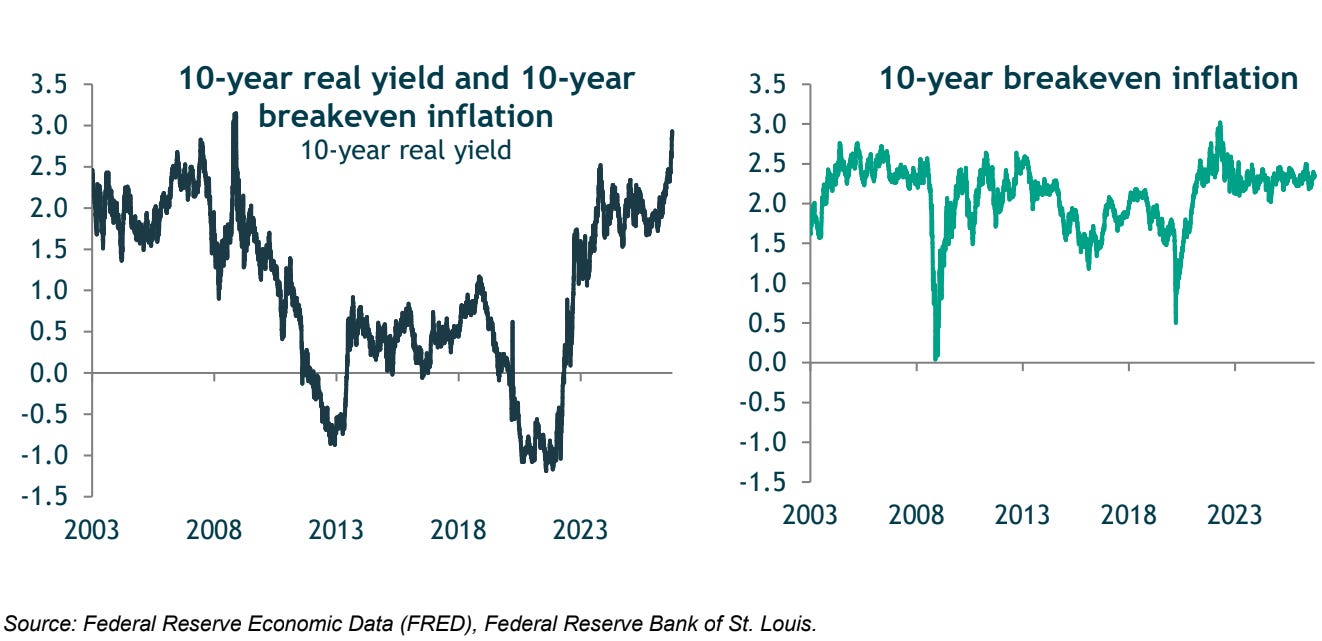
The rate surge isn't solely driven by inflation; long-run inflation expectations remain anchored, while real yields have surged. Part of this rise in long-term real rates alongside stable inflation expectations highlights a huge CAPEX-driven economy.
The economy is outperforming consensus expectations, supported by an unprecedented capital-spending boom.
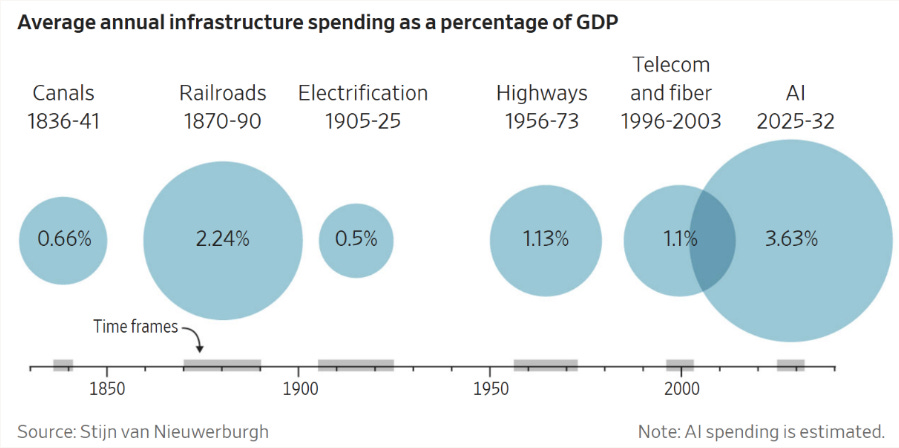
Major tech platforms are deploying nearly $600 billion in CAPEX this year, primarily for AI infrastructure. With the Atlanta Fed’s real-time tracker exceeding 4% in Q3 and inflation above 3%, nominal GDP growth is around 7%—a pace rarely sustained post-GFC, naturally putting upward pressure on interest rates.
Accelerating bond supply also exerts upward pressure on rates, driven by a fiscal 2026 federal deficit near $2 trillion (>6% of GDP) with no political appetite to curb spending. To fund this, Treasury issuance remains heavy.
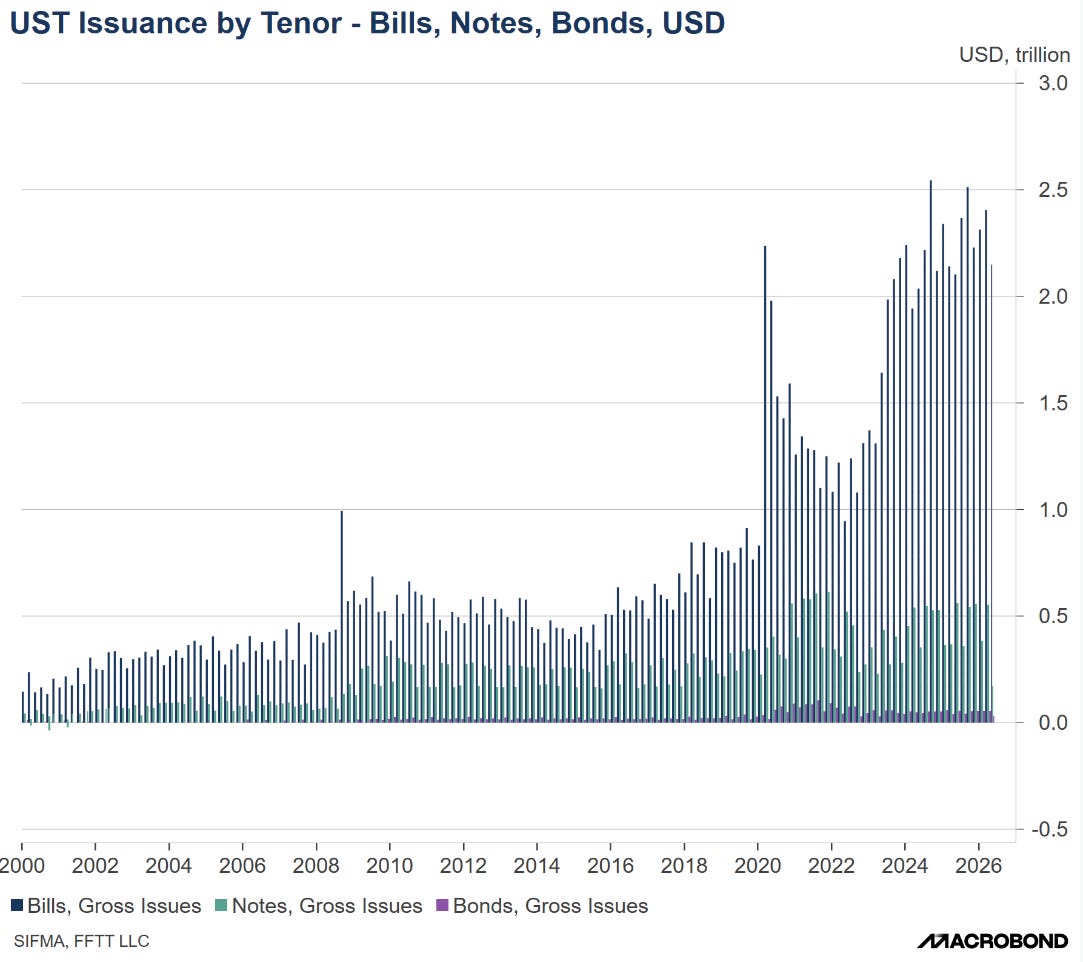
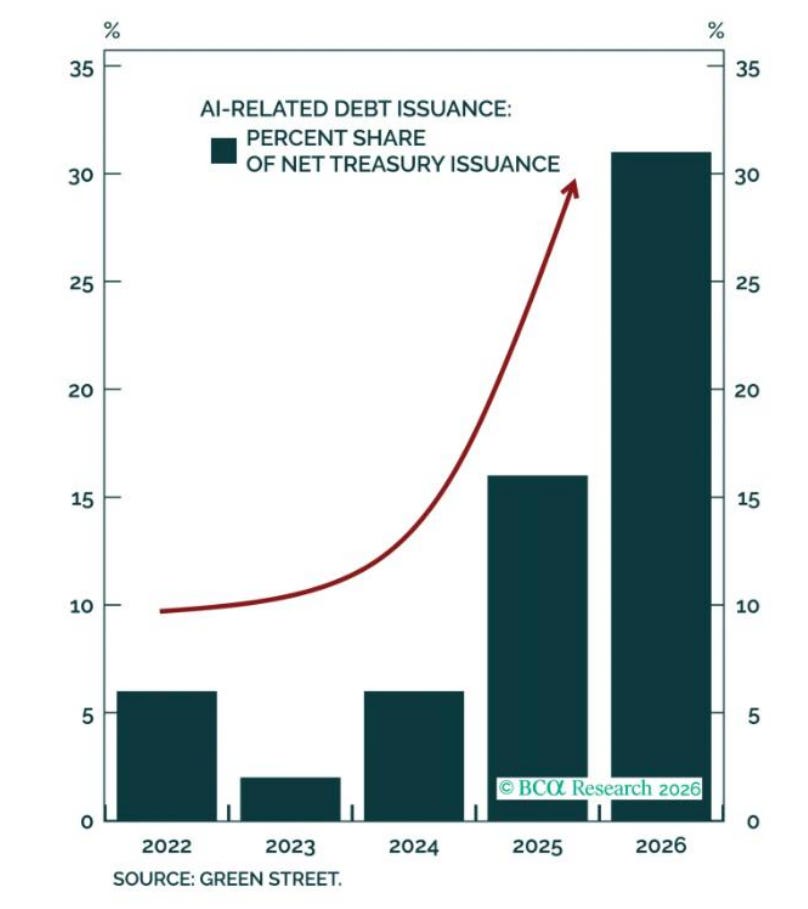
Concurrently, corporate debt issuance is surging as hyperscalers finance the AI buildout in the bond market. AI debt issuance has risen from 5% of net Treasury issuance last year to over 30% today. Investor capital absorbed by hyperscaler debt reduces demand for Treasuries, driving market-clearing yields higher.
At the same time, foreigners are not recycling their trade surplus back into US Treasuries like they used to.
According to Brad Setser from the Council on Foreign Relations, foreign purchases of US bonds have largely ceased despite East Asia (the world’s factory) running a massive and growing trade surplus.
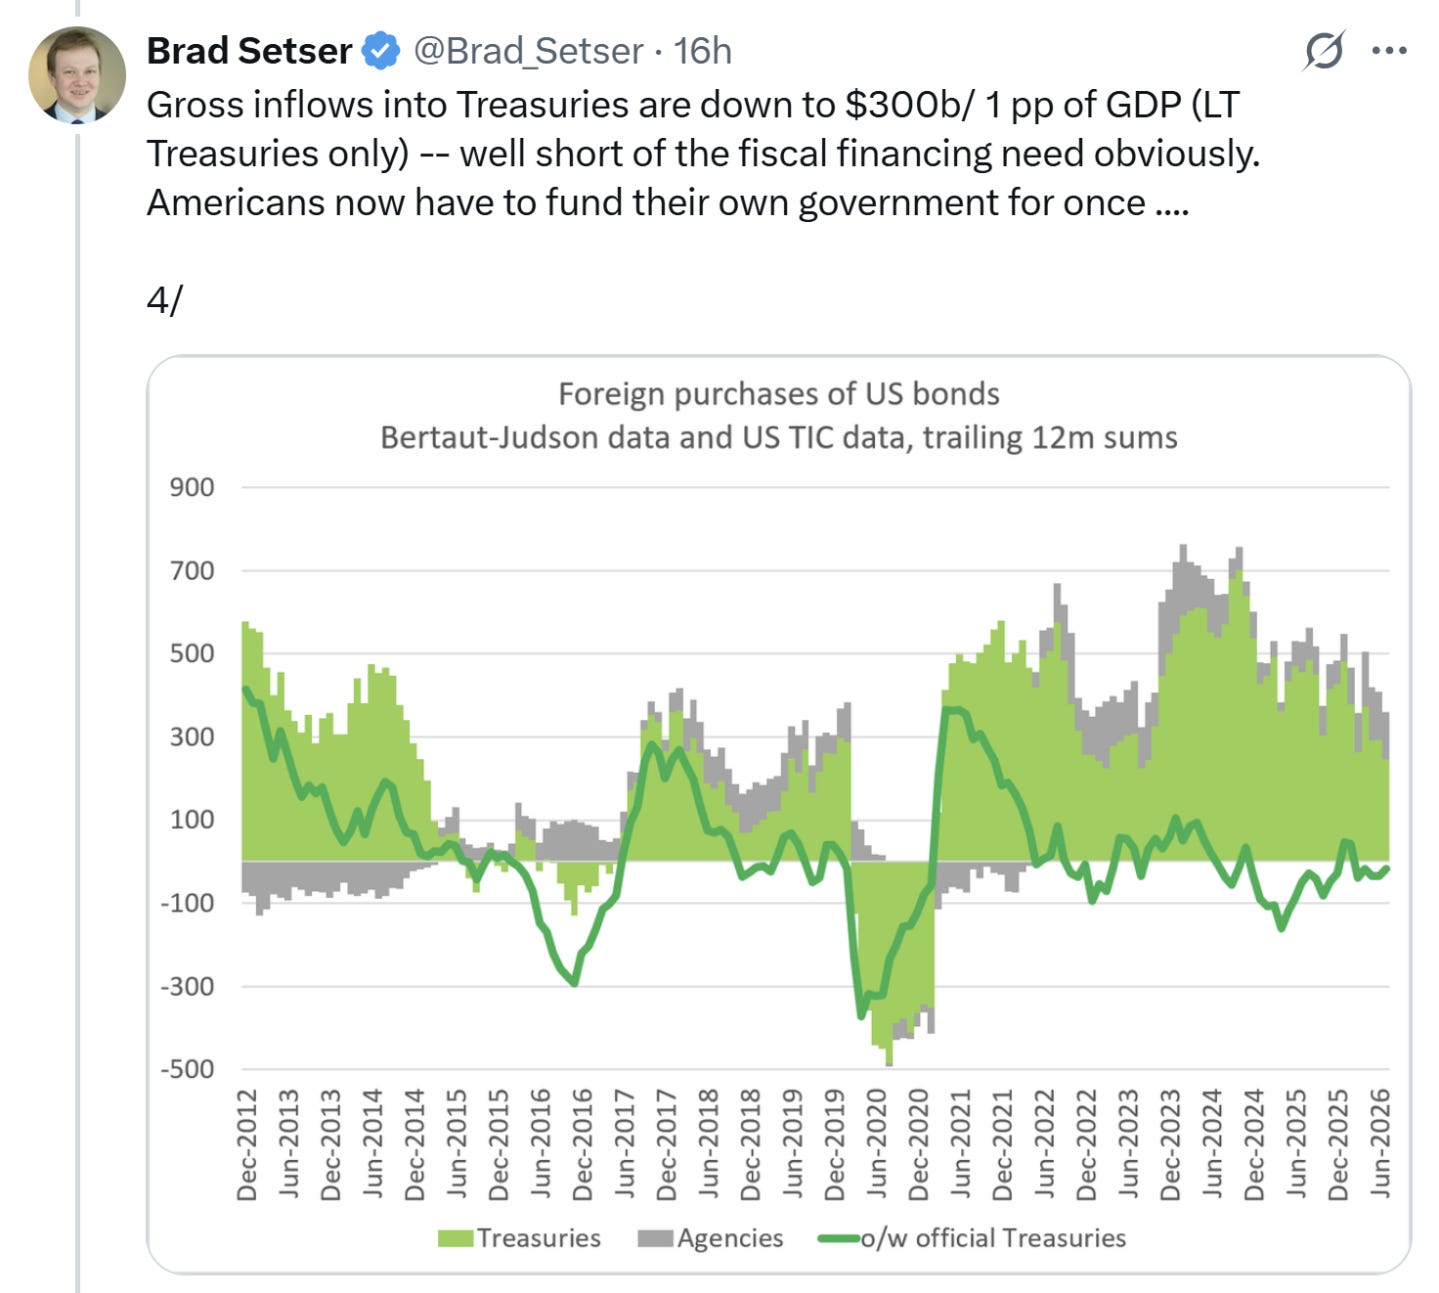
He aptly adds that Americans now have to fund their own government for once.
Context Pitstop
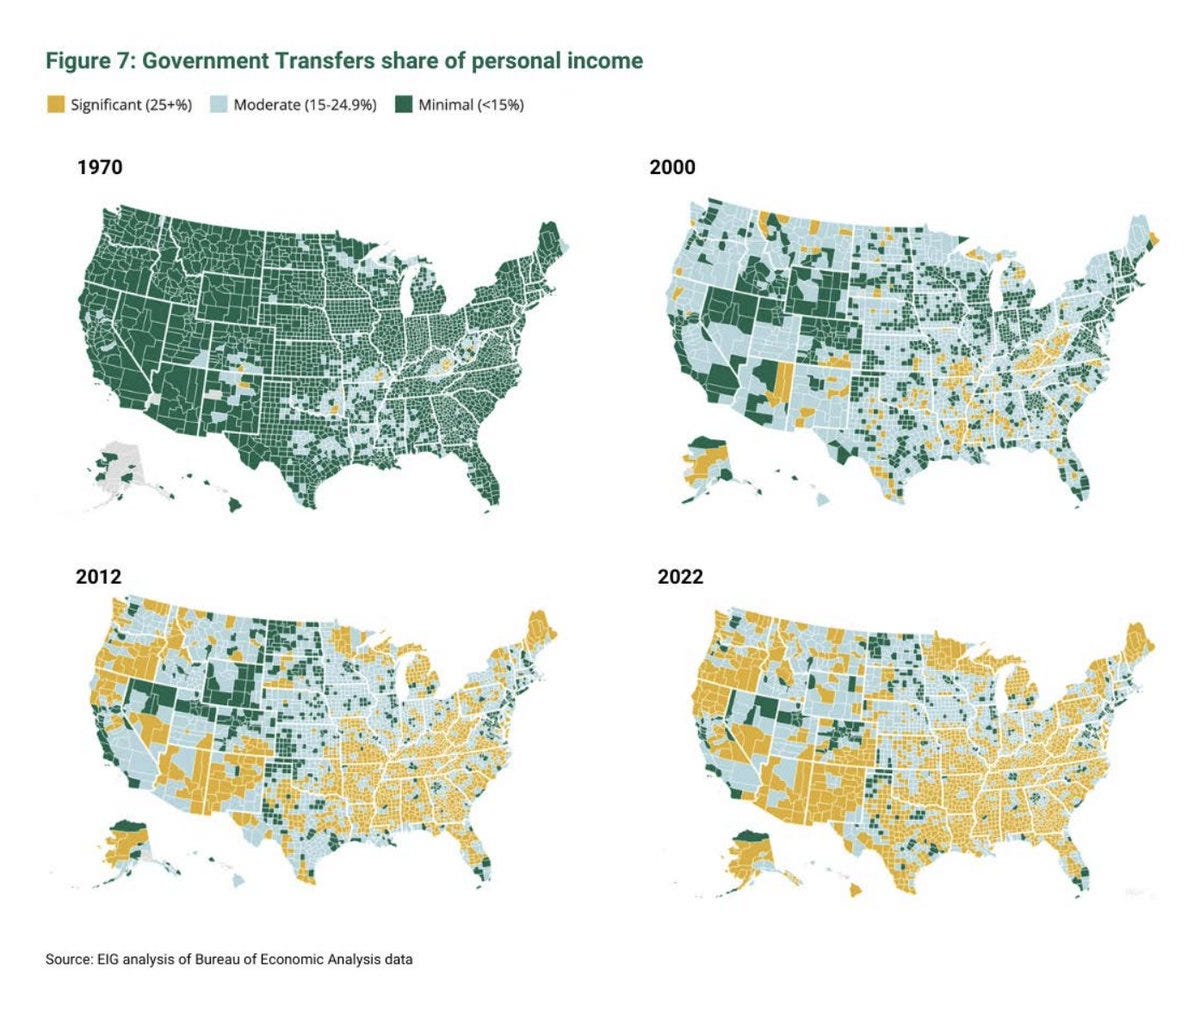
Over 25% of U.S. consumer personal income relies on federal subsidies—and by extension, foreign capital inflows.
He added that despite record foreign US equity flows, only $400 billion of East Asia’s $1.8 trillion surplus (including China’s $1.2 trillion) is recycled into US assets.
The remaining trade surplus is “missing”.
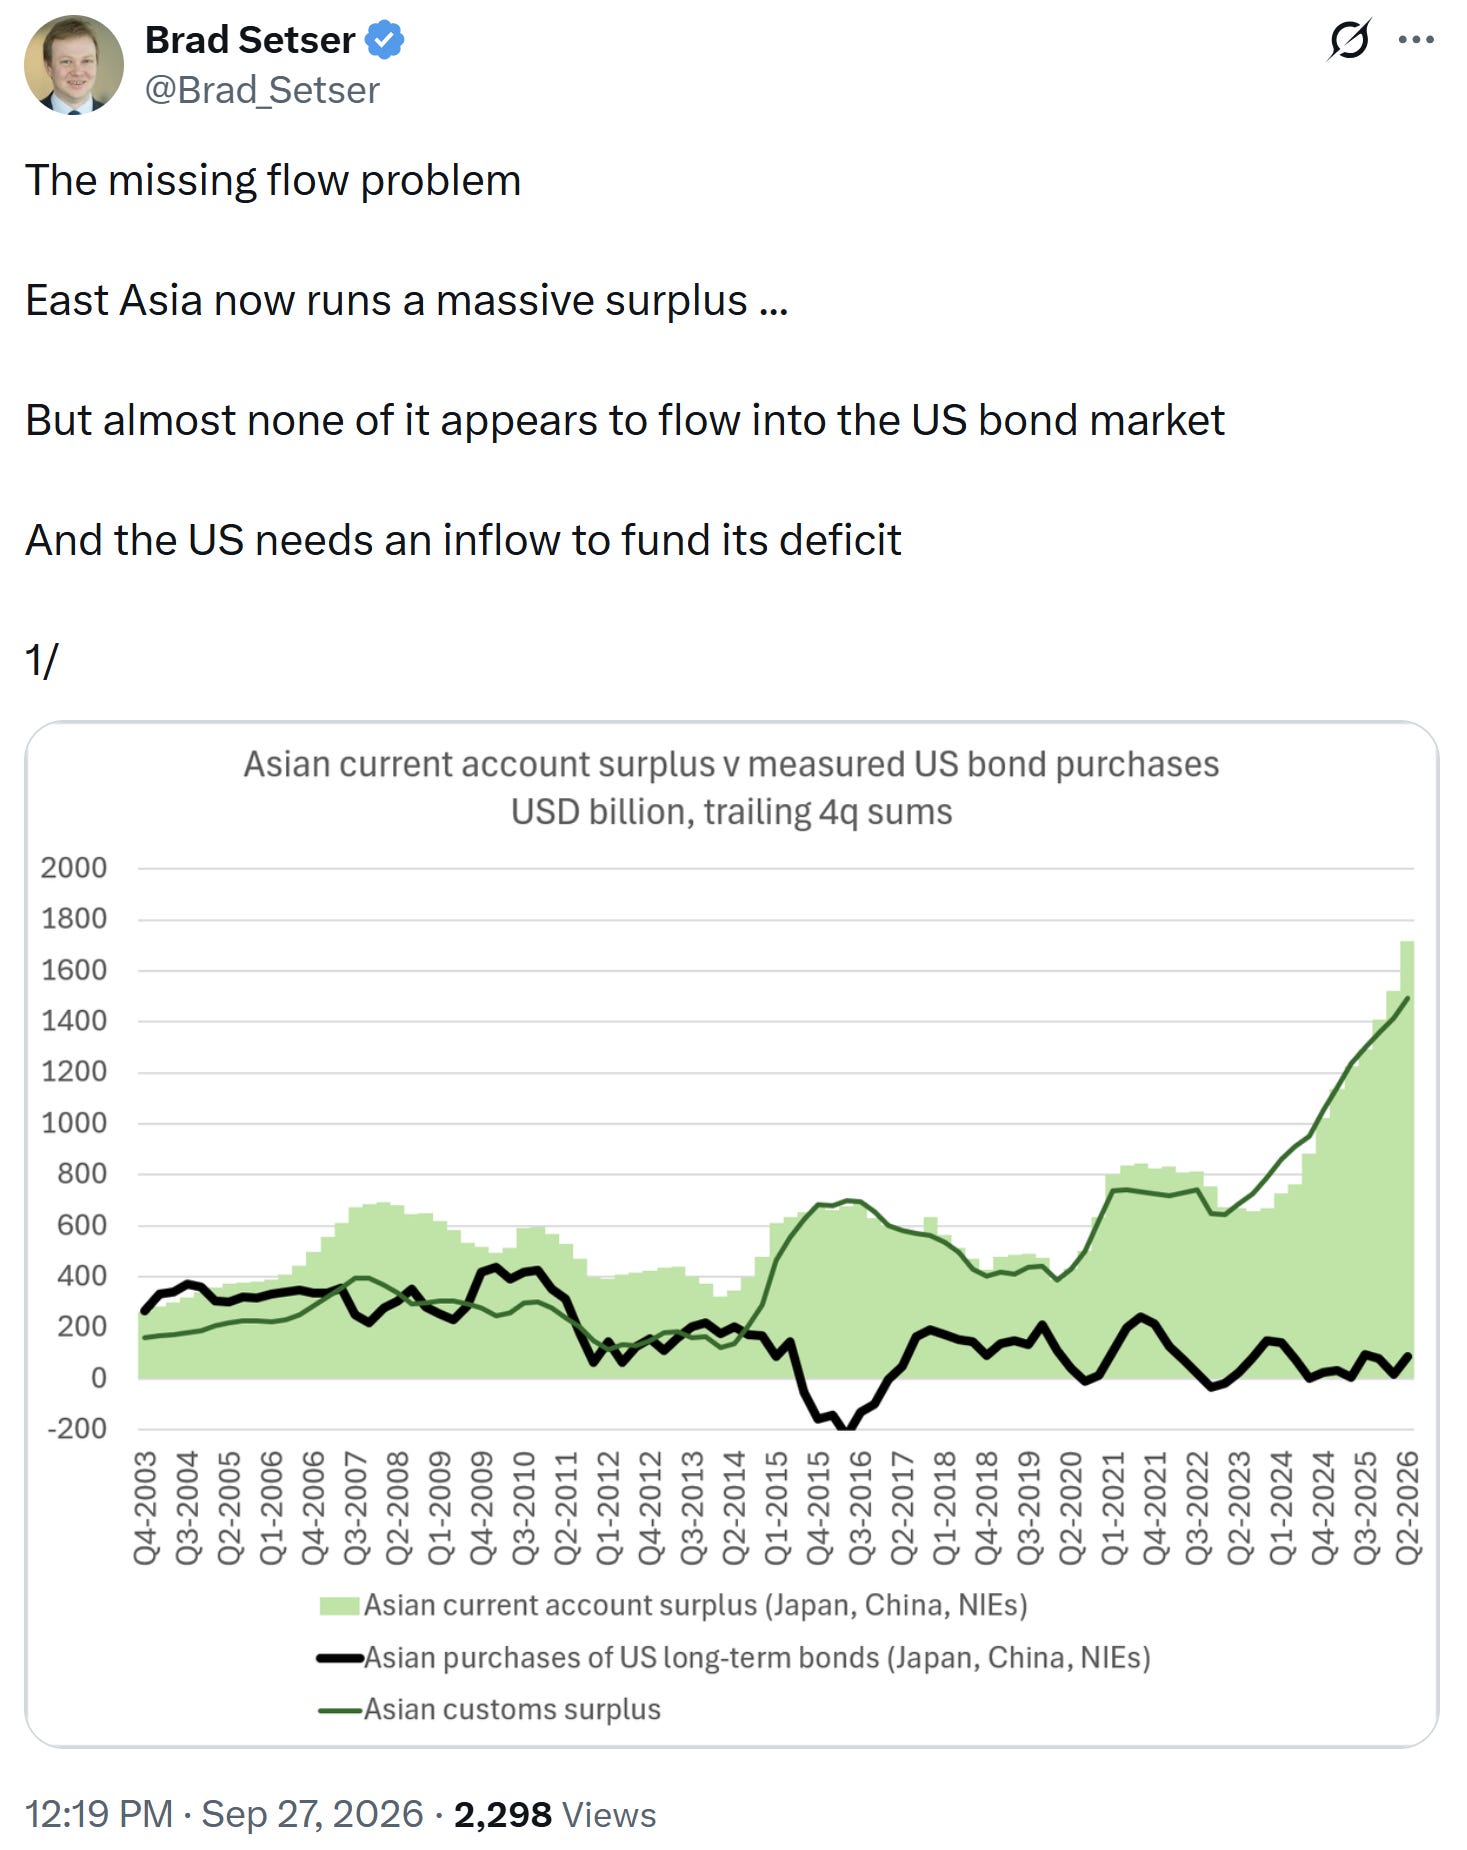
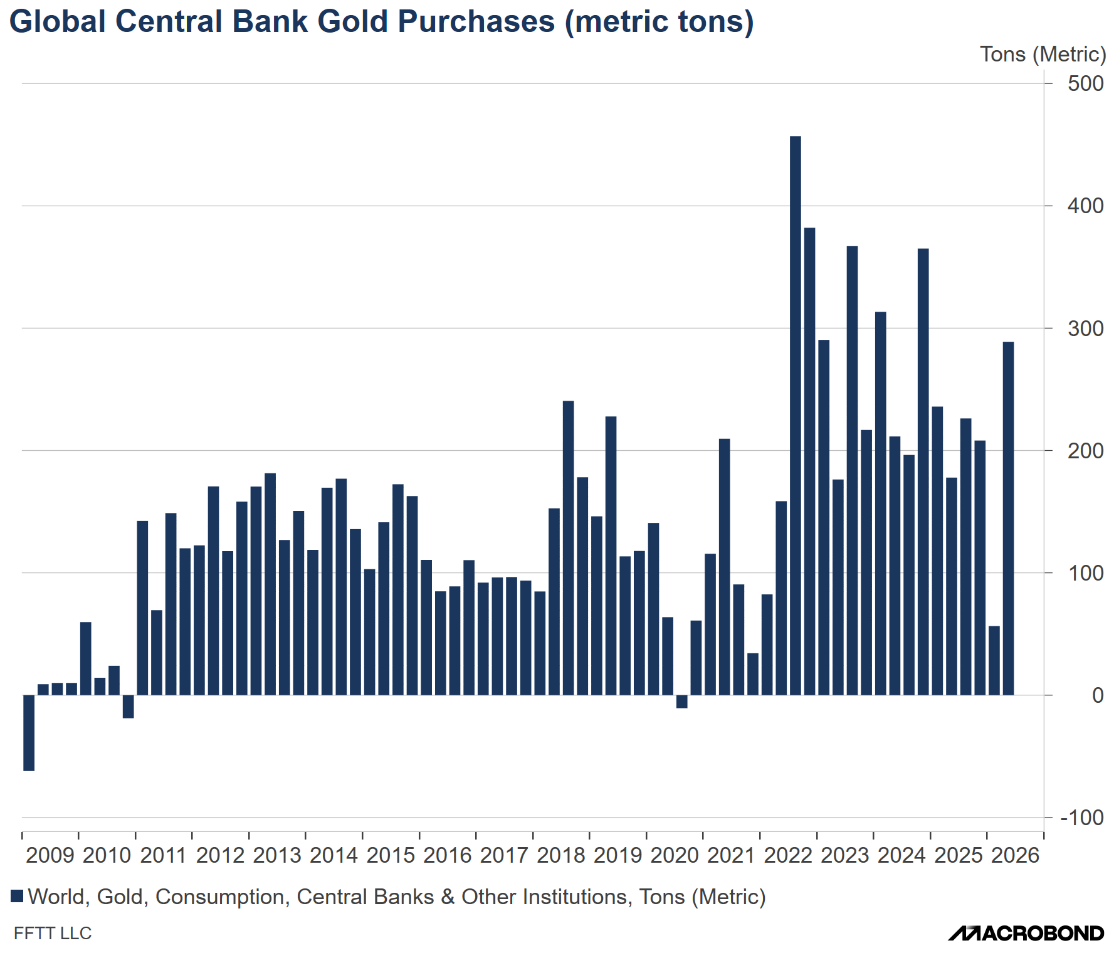
We think these “missing” flows are partly flowing into gold and other foreign bonds.
Flows Into Gold
Bank of Korea Makes First Gold Linked Investment in 13 Years
The German Bundesbank sees a good case for central bank diversification into gold
Flows into Foreign Bonds
Japanese life insurers are going home not mainly because Treasuries got worse, but because Japanese bonds finally got “good enough.”
The insurers carry yen liabilities costing about 2%. During yield-curve control, JGBs paid roughly zero, so they bought Treasuries and other foreign bonds, and Japan became the largest foreign holder of Treasuries.
What changed is that by midsummer the 10-year JGB yielded about 2.9% and the 30-year about 4%. Those yields cover yen promises with no currency risk and no hedges to roll, beating hedged Treasuries.
Insurers don’t need to sell Treasuries for this to matter. They just stop buying new issues and stop replacing bonds that mature.
That removes a dependable buyer, one that didn’t demand much yield, from long-dated bond markets worldwide, which helps explain why US, UK, German and Japanese long yields rose together.
The chart below illustrates when a Japan Hedged Yield on a US 10 Year Bond was net attractive (green) and when it was net unattractive (red) relative to owning its own domestic JGBs.
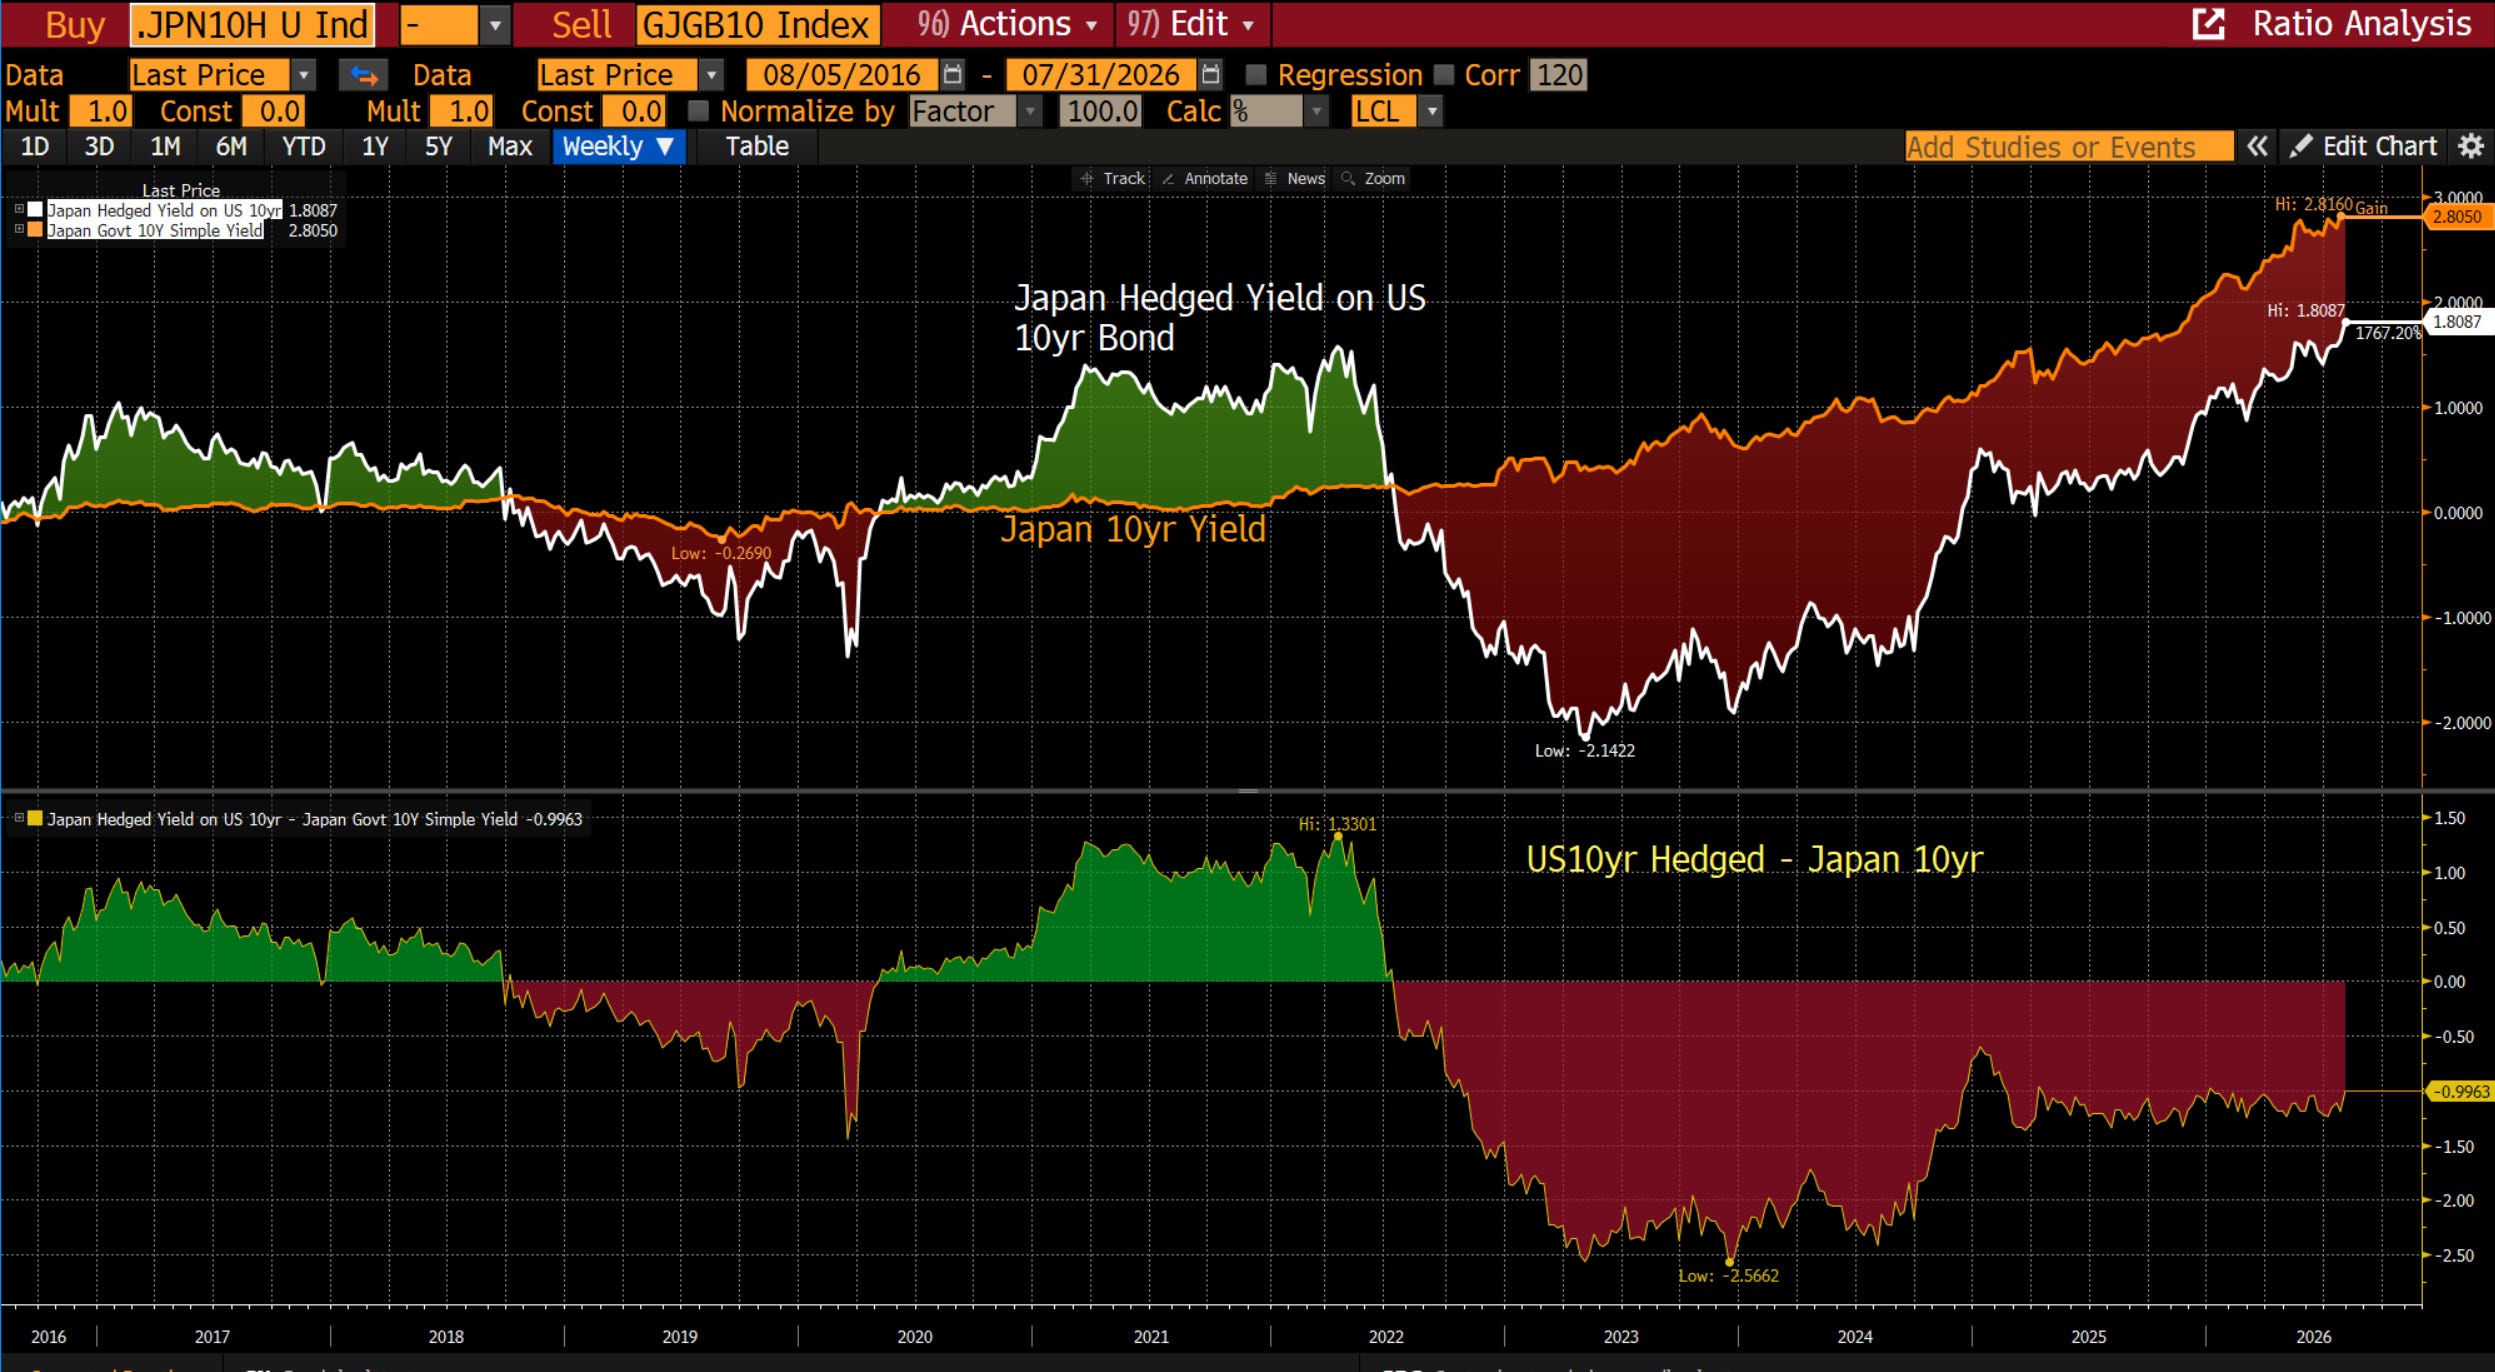

Ultimately, bond issuance is massively accelerating from both accelerating fiscal deficits and a massive AI CAPEX boom which competes for bond demand which itself is slowing as the largest historical bond buyers (foreigners) of US Treasuries are materially stepping back.
Supply > Demand = Lower Prices i.e. Higher Yields.
The AI Trade 360° Turn
The AI trade experienced a volatile arc this quarter, sliding in July before sharply reviving in September. Crowded positioning and leverage from a major AI hedge fund triggered a swift drawdown.
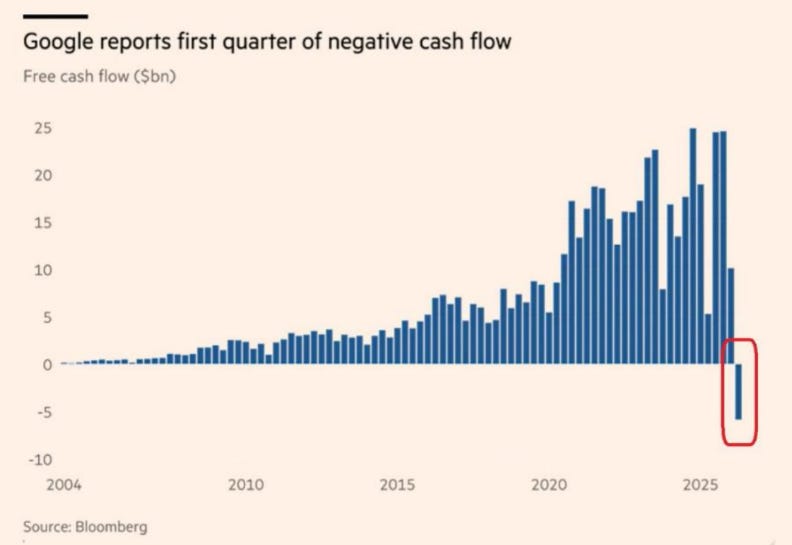
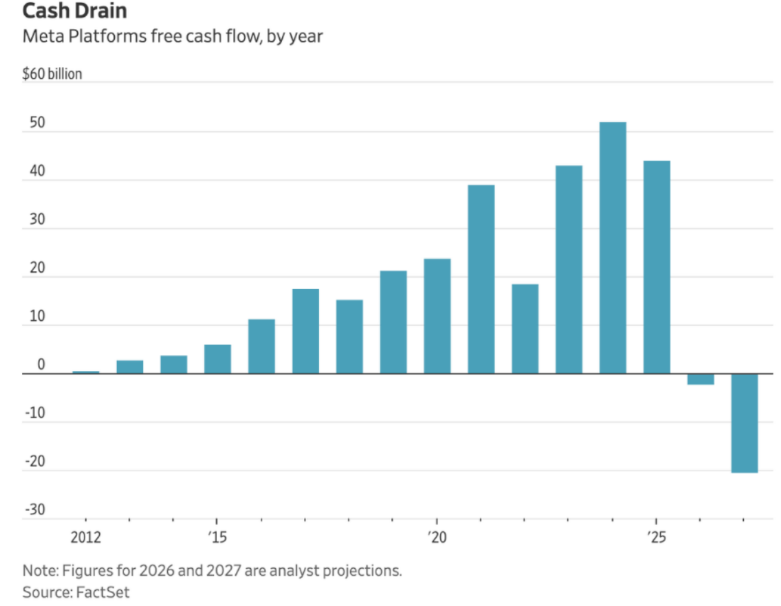
Sentiment temporarily flipped as investors penalized rising capital expenditures: Alphabet fell over 7% despite beating expectations as CAPEX surged and free cash flow turned negative for the first time since 2004, with Meta seeing similar market reactions.
Technology equities entered their second correction of the year, yet remain up 28.4% YTD, trailing only energy.
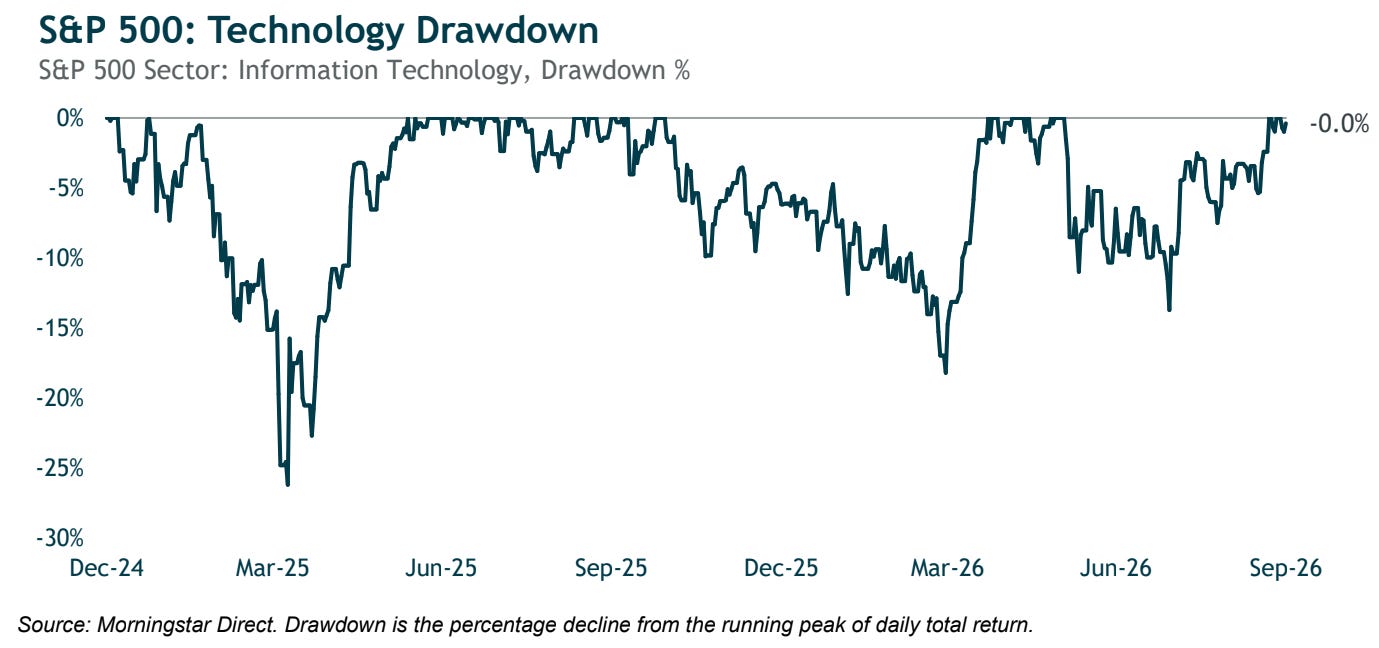
Following position resets, the AI trade rebounded strongly, with tech stocks gaining 16.2% from late-July bottoms through quarter-end. NVIDIA’s late-August results highlighted massive ongoing spending, reporting $96 billion in revenue (up 106% YoY) and strong guidance. Its nearly 9% stock surge lifted the broader tech sector, defying headwinds from rising long-term interest rates that typically weigh on tech valuations.
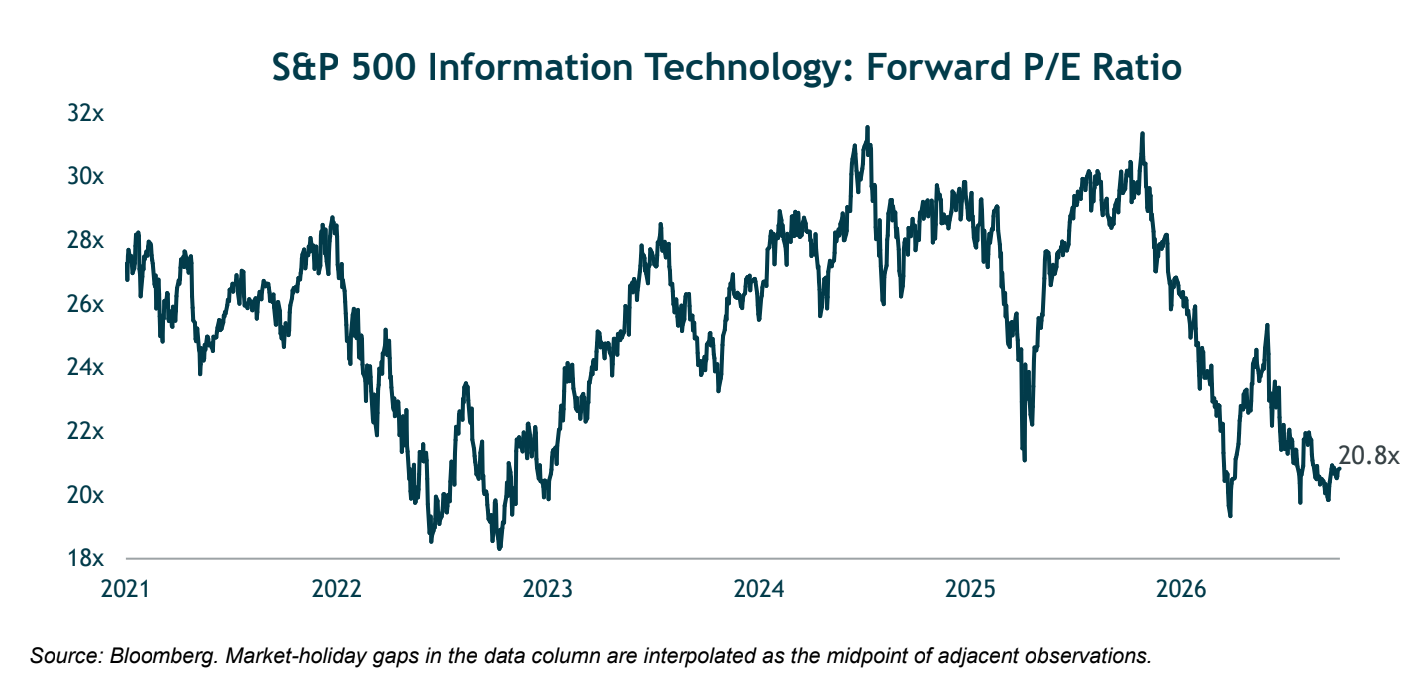
Where does this leave equities? Real earnings and AI infrastructure spending—and its financing—are driving the market. S&P 500 Q3 earnings are expected to grow ~29% YoY, marking a third straight quarter above 25%, led by tech and communication services. Tech earnings are projected to rise 65% YoY (FactSet), pulling the sector’s forward multiple (~20x) below its five-year average due to rapid earnings growth.
Going Forward
Q4 brings a busy calendar: November 3rd midterms, Fed meetings (October 27–28 and early December), mid-October Q3 earnings with 29% growth expectations, and a continuing resolution funding the government through December 11th.
Regarding midterms, control of all 435 House seats and a third of the Senate is at stake. Betting markets currently favor a Democratic sweep, though turnover is common in populist eras. Historically, markets perform well under a divided government, which preserves the policy status quo. However, given current deficits and yield curve pressures, the election’s key impact will be its fiscal signal. We will watch the bond market closely, but reiterate our core view: do not position portfolios based on political forecasts—vote at the polls, not in your portfolio.
Regarding the Fed, markets enter Q4 pricing an October pause as probable and a December hike as the base case, which aligns with our view. Milder late-September inflation reduced October hike urgency, and upcoming midterms discourage political moves. We expect no pivot to easing, as the Fed remains committed to prioritizing inflation.
In short, with nominal growth around 7%, inflation near 3%, a hiking Fed, and heavy capital competition between the Treasury and AI hyperscalers, multi-decade high interest rates are no surprise.
Supply > Demand = Higher Price i.e. Higher Yields.
We maintain the importance of staying fully invested and diversified given high market concentration and a single driving theme.
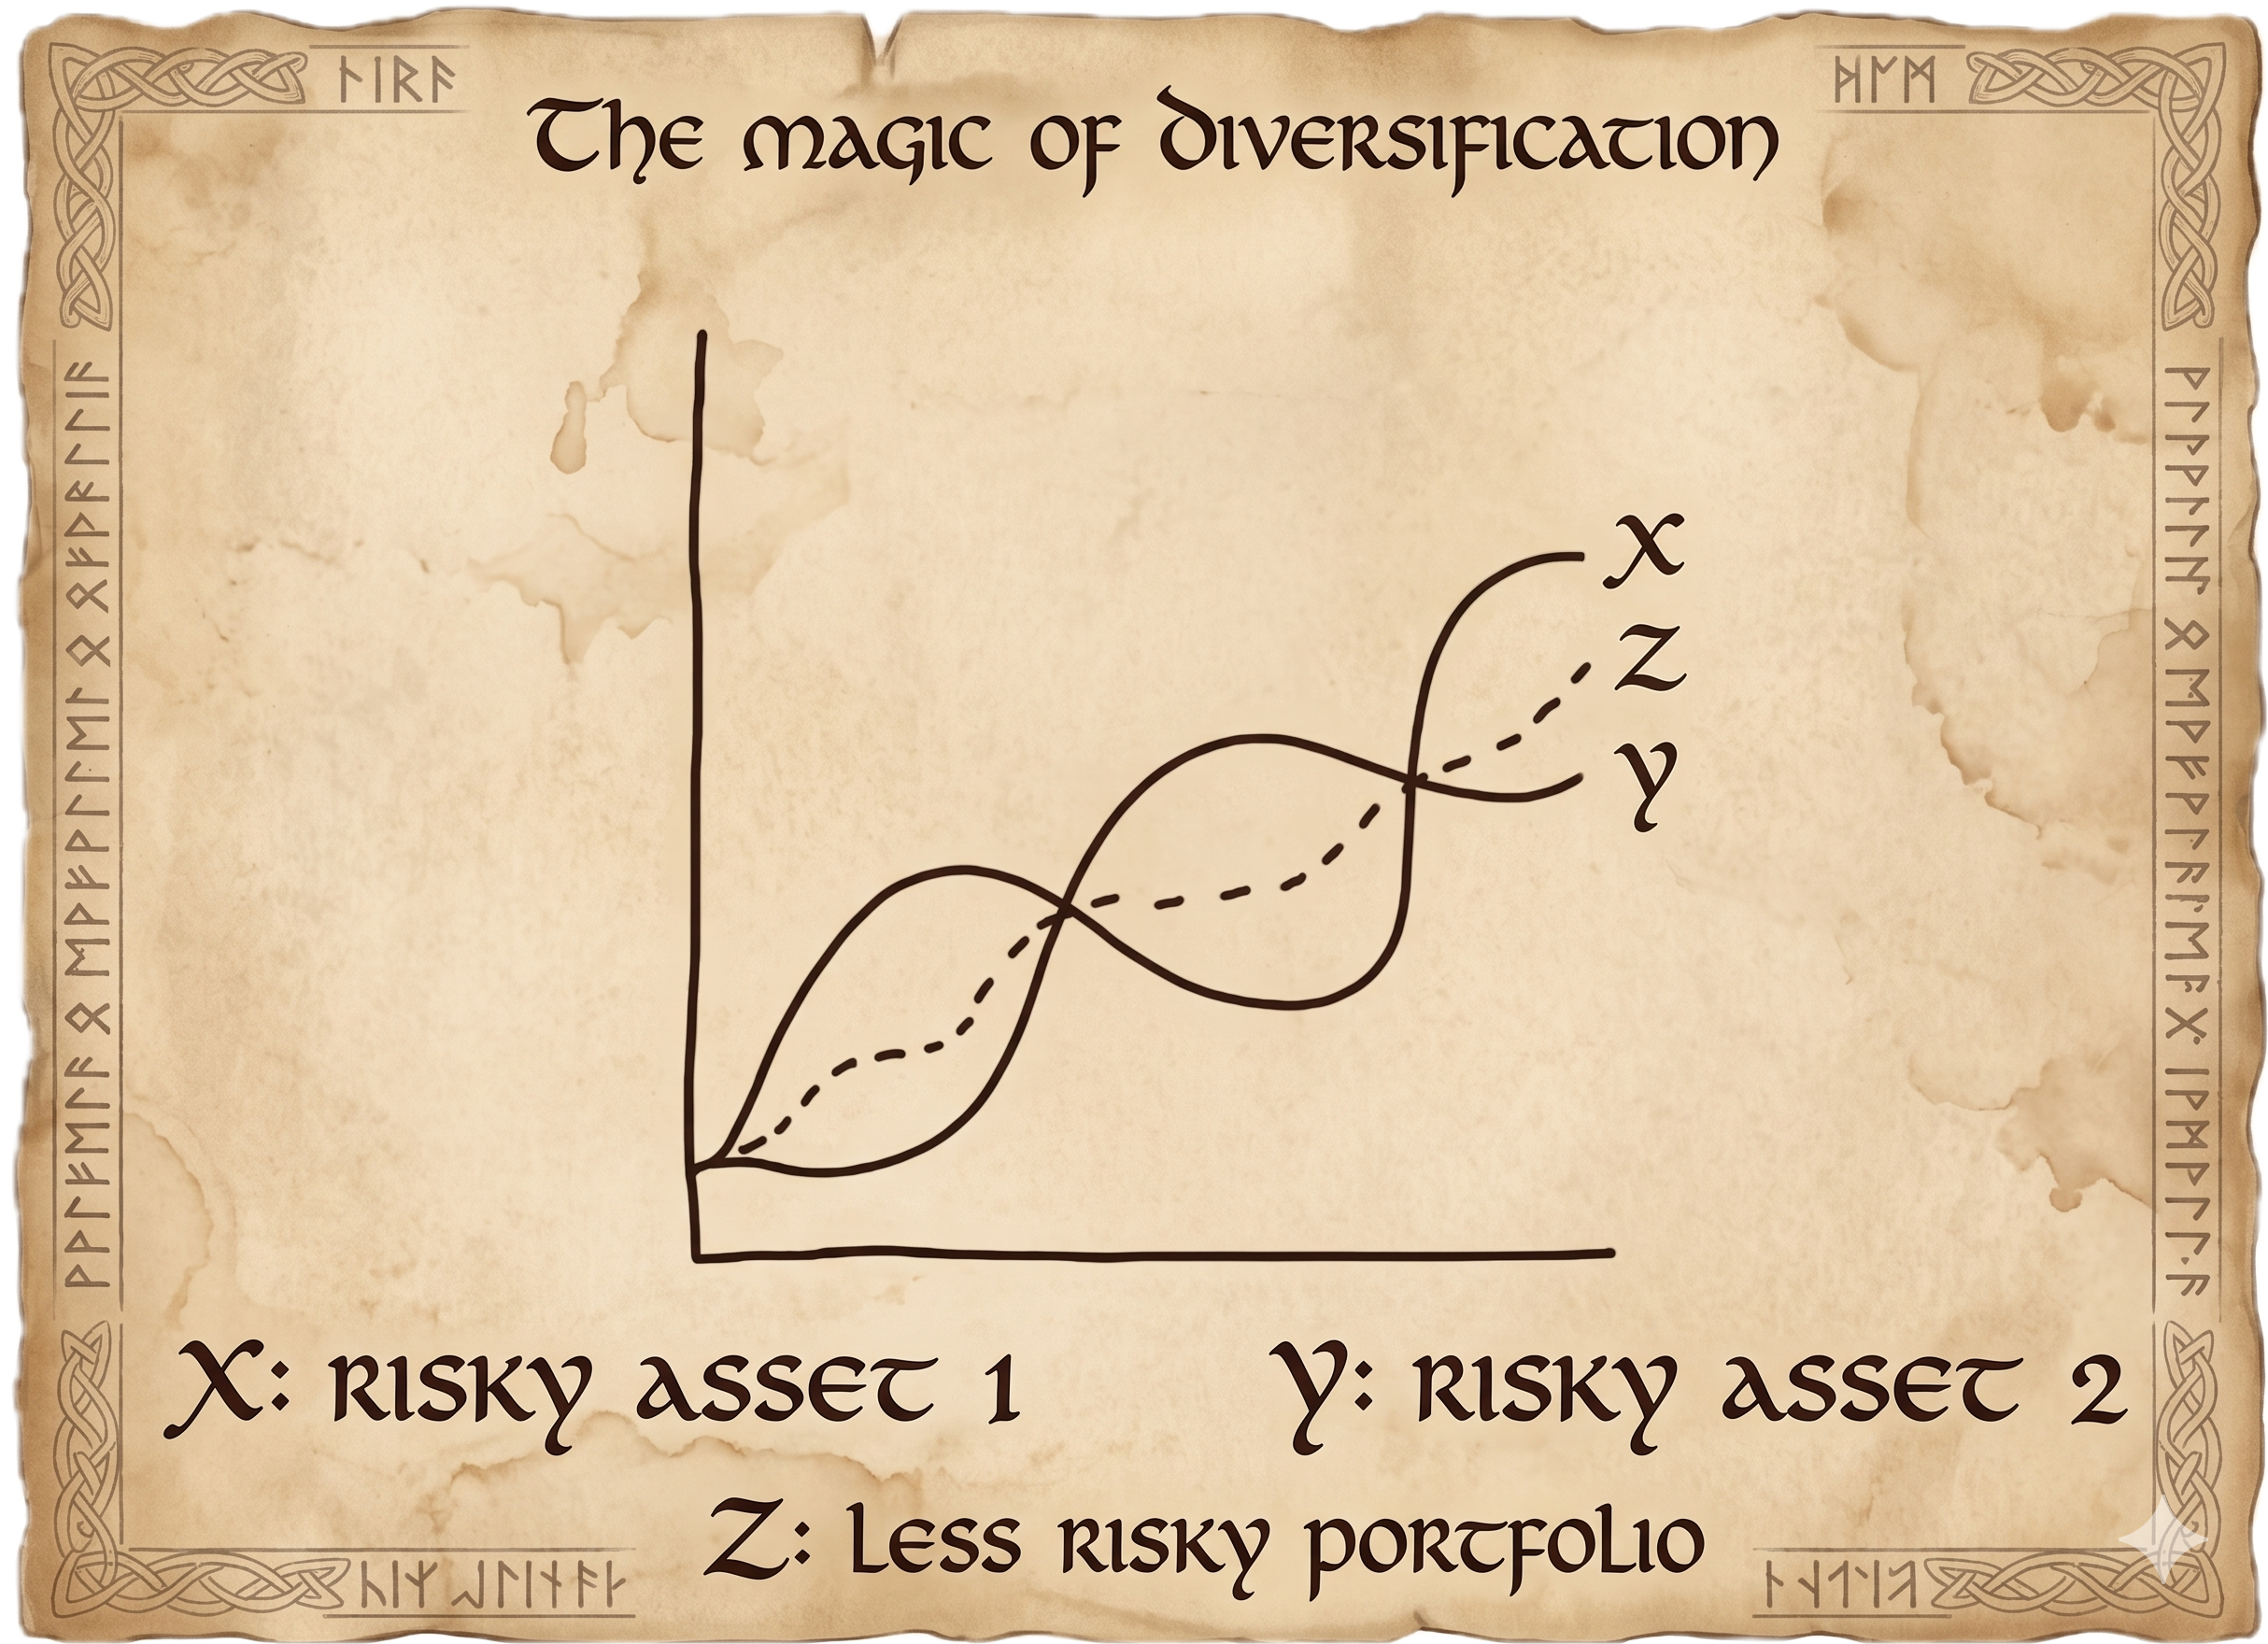
We are diversified across directions (long and short) and across the full spectrum of investment classes (equities, bonds, commodities, and currencies).
Going long means making money when prices rise.
This is buying low then selling high.
Going short means making money when prices fall.
This is selling high then buying low.
Thank you for your continued partnership.

Disclaimer
This website is not an offer or solicitation in any jurisdiction in which the firm is not registered. Information presented is for educational purposes only. It should not be considered specific investment advice, does not take into consideration your specific situation, and does not intend to make an offer or solicitation for the sale or purchase of any securities or investment strategies. The services, securities and financial instruments described on this website may not be suitable for you, and not all strategies are appropriate at all times. Investments involve risk and are not guaranteed. Past performance is not necessarily a guide to future performance. Independent advice should be sought in all cases.
Valinor Wealth Management is a U.S. Securities and Exchange Commission (SEC) Registered Investment Advisor . Registration does not imply a certain level of skill or training. Information about the firm including the Customer Relationship Summary is available on the SEC’s website at www.adviserinfo.sec.gov.